

WTI Technical Analysis: Fails to extend the bounce off 200-bar SMA, 61.8% Fibonacci
- WTI stays mildly bid after the recent recovery.
- Bearish MACD, a sluggish strength of pullback could favor the Bears.
- Buyers will look for entry beyond the short-term support-turned-resistance area.
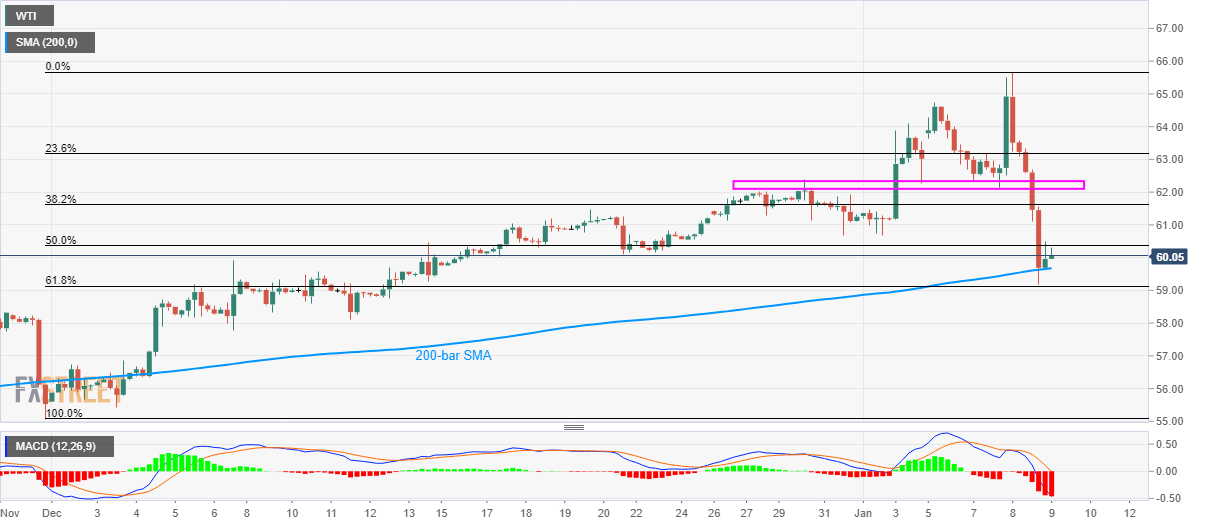
WTI seesaws around $60.10/15 during early Thursday. The black gold recently bounced off 61.8% Fibonacci retracement of November 29 low to Wednesday’s high as well as cleared 200-bar SMA. Even so, bearish signals from MACD and a soft recovery portray underlying weakness in the momentum.
As a result, sellers will be on the lookout of entry below the key Fibonacci retracement level of $59.10. Though, 200-bar SMA around $59.70 can be considered as immediate support.
If at all the black gold slips below $59.10, also smash $59.00 round-figure, December 06 low near $57.77 and December 06 high near $56.70 will return to the charts.
Assuming oil price recovery, lows marked during last-week around $60.70 can act as the adjacent resistance ahead of the $62.10/35 area comprising December-end top and lows marked on January 03 and 07.
However, the commodity’s successful rally past-$62.35 enables it to challenge the latest top of $65.67 while targeting $66.00 during further upside.
WTI four-hour chart
Trend: Pullback expected