GBP/USD Price Analysis: Probes five-week-old falling trendline near 1.3080
- GBP/USD holds on to recovery gains from a three-month long ascending support line.
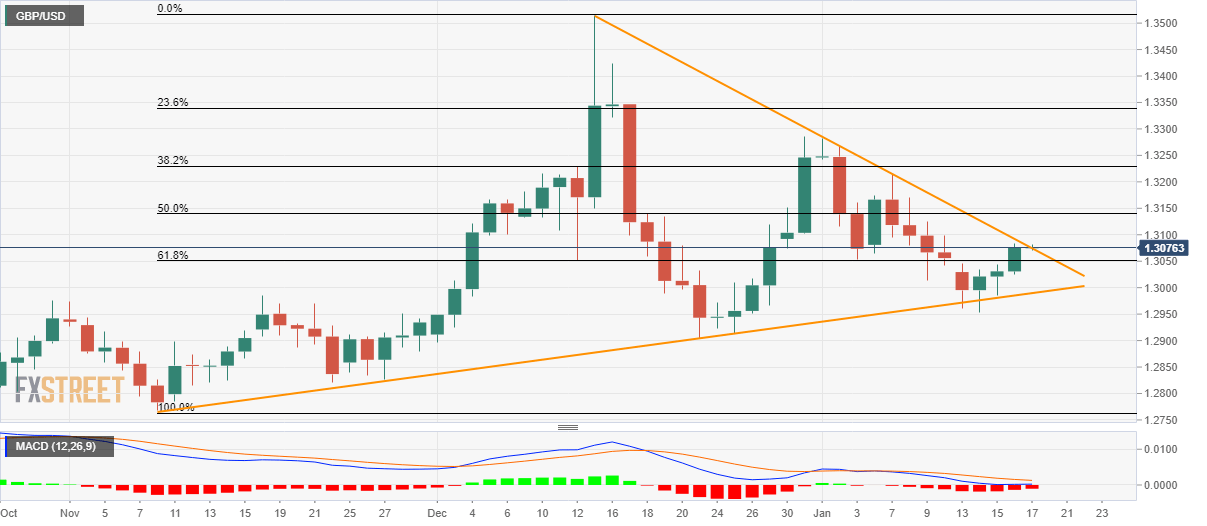
- 50% Fibonacci retracement, January 07 top on buyers’ radar.
- Sub-1.3000 area could return to charts on the downside break of the medium-term rising trend line.
GBP/USD stays positive around a one-week high while taking the bids to 1.3080 during the Asian session on Friday. The pair confronts a short-term key resistance trend line following its U-turn from a multi-month-old rising support line.
If buyers manage to ignore bearish MACD, also provide a daily close beyond 1.3080 resistance line, 50% Fibonacci retracement of pair’s November-December 2019 upside, at 1.3140, could lure the buyers.
Though, January 07 high close to 1.3215 and the monthly top surrounding 1.3280 can challenge the bulls afterward.
On the downside, 61.8% Fibonacci retracement level at 1.3050 can restrict the pair’s short-term downside ahead of highlighting an upward sloping trend line stretched from early November, at 1.2990.
In a case where the bears sneak in around 1.2990, late-December 2019 low around 1.2900 will be their target.
GBP/USD daily chart
Trend: Further recovery expected