AUD/JPY Price Analysis: 61.8% Fibonacci, short-term supportline to challenge recent pullback
- AUD/JPY pauses the latest declines while staying between the key technical levels.
- An eight-day-old rising trend line, 61.8% Fibonacci retracement limits immediate downside.
- 21-day SMA, 50% Fibonacci retracement challenges the short-term buyers.
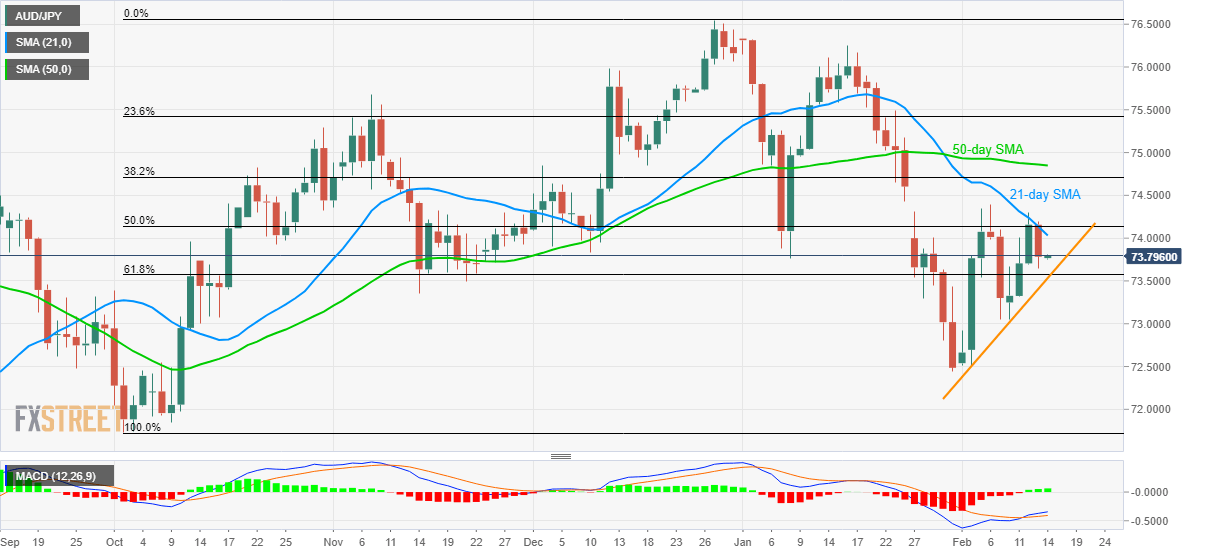
AUD/JPY consolidates the latest losses to 73.80 by the press time of the early Asian session on Friday. The pair previously pulled back from 21-day SMA. Even so, it still trades above short-term support line and 61.8% Fibonacci retracement of its run-up from October to December 2019.
However, bullish MACD increases the odds for the pair’s further recovery towards the monthly high surrounding 74.40 if it successfully clears 21-day SMA and 50% of Fibonacci retracement, respectively around 74.00 and 74.15.
During the pair’s rise past-74.40, 50-day SMA around 74.85 and 75.00 round-figure will be on the buyers’ radars.
Meanwhile, a downside break of 73.60/55 support confluence can drag it to 73.00 ahead of highlighting the January 31 bottom of 72.44 for sellers.
If AUD/JPY prices keep trading southwards below 72.40, October 2019 trough around 71.70 could lure the bears.
AUD/JPY daily chart
Trend: Sideways