Mengonfirmasi Anda bukan dari AS atau Filipina

Dengan memberikan pernyataan ini, saya secara tegas menyatakan dan mengonfirmasikan bahwa:
  • Saya bukan warga negara atau penduduk AS
  • Saya bukan penduduk Filipina
  • Saya, secara langsung maupun tidak langsung, tidak memiliki lebih dari 10% saham/hak suara/kepentingan dari penduduk AS dan/atau tidak mengontrol warga negara atau penduduk AS dengan cara lain
  • Saya tidak berada di bawah kepemilikan langsung atau tidak langsung untuk lebih dari 10% saham/hak suara/kepentingan dan/atau berada di bawah kontrol warga negara atau penduduk AS dengan cara lain
  • Saya tidak berafiliasi dengan warga negara atau penduduk AS dalam hal Bagian 1504(a) dari FATCA
  • Saya menyadari tanggung jawab saya jika membuat pernyataan palsu.
Untuk tujuan pernyataan ini, semua negara dan wilayah dependen AS disamakan dengan wilayah utama AS. Saya berkomitmen untuk membela dan membebaskan Octa Markets Incorporated, direktur dan pejabatnya dari klaim apa pun yang timbul akibat atau terkait dengan pelanggaran apa pun atas pernyataan saya.
Kami berkomitmen menjaga privasi dan keamanan informasi pribadi Anda. Kami hanya mengumpulkan email untuk menyediakan penawaran khusus dan informasi penting tentang produk dan layanan kami. Dengan memberikan alamat email, Anda setuju untuk menerima surat tersebut dari kami. Jika Anda ingin berhenti berlangganan atau memiliki pertanyaan maupun permasalahan, silakan hubungi Layanan Pelanggan kami.
Back

AUD/JPY Price Analysis: Bears looking for monthly weekly and daily bearish confluence

  • AUD/JPY is an attractive short below the daily structure.
  • Currently, the stars do not quite align across all time frames from a top-down market structure analysis. 

The Monthly is bearish and is looking as though it wants to form a head and shoulders.

The weekly is proving that there is resistance that first needs to hold the bullish commitments at this juncture.

The daily chart has a strong bullish bias while holding above a strong support structure along with the ascending trendline support.

Monthly chart
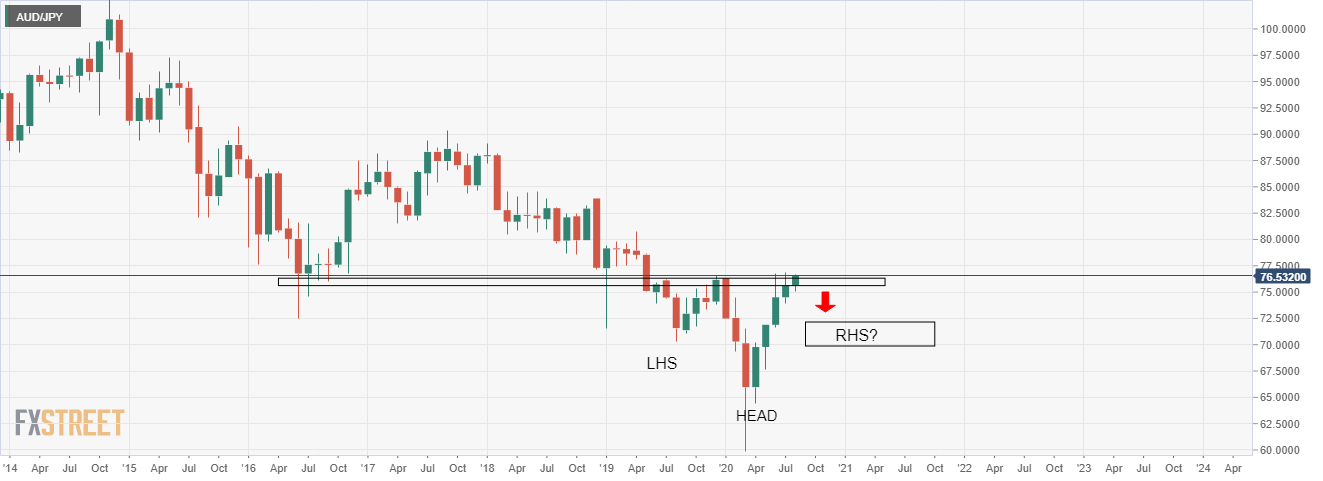
The above chart shows a potential reversal head and shoulders pattern in the making, offering downside target opportunities for the bears. 

Weekly chart

The weekly chart is showing that the bulls are trying for a second attempt a the resistance. Should they fail, the prospects for the head and shoulders are sound.

Daily chart

The daily support structure is a confluence of higher lows, the support trendline and a restest of the structure which confirms a bullish bias.


However, should the same confluence breakdown, then bears will be looking to take over in the barroom brawl zone and a shorting opportunity on a retest of broken support structure turned resistance. 

When is the Australia unemployment rate and how could it affect AUD/USD?

July month employment statistics from the Australian Bureau of Statistics, up for publishing at 01:30 GMT on Thursday, will be the immediate catalyst
Baca selengkapnya Previous

EUR/USD Price Analysis: Falling wedge breakout suggests bull revival

EUR/USD is currently chipping away at the psychological hurdle of 1.18, having put in a low of 1.1711 on Wednesday. The 4-hour chart shows a falling w
Baca selengkapnya Next